


by Alex Savitski, Ph.D.; Leo Klinstein, Kenneth Holt, Hardik Pathak, David Cermak
Dukane IAS, LLC
Ultrasonic welding of thermoplastics is widely used by many industries to fuse together two parts in a short time without introducing additional consumables such as fasteners, adhesives or solvents. The process is fast, economical and easily automated, and it is commonly controlled by time, energy or weld distance to achieve a weld of predicted quality [1]. It is generally accepted that the most reliable control mode for the ultrasonic weld process is the “weld by distance” option, which is available with most computer-controlled welding equipment.
For weld joint designs using an energy director style interface, the optimum weld distance for strength and repeatability of the weld typically is set at a value based on the size and height of the energy director. However, this setting may not guarantee that the weld will be strong and free of excessive flash.
For instance, if an energy director is not melted, but rather partially deformed during the weld process, the deformation will be interpreted by the welding process controller as part of the weld distance, even though the movement occurred without melting. The result of this is a cold weld, during which there is more physical deformation than actual melting of the energy director. Possible reasons for cold weld formation may include energy director molding inconsistencies, excessive trigger force, part misalignment, incorrect frequency selection, inadequate amplitude and many others.
Alternatively, reaching the programmed weld depth also can result in excessive flash. This occurs when the energy director is shorter than expected, as would occur in a part with inadequately filled energy director details (resulting from molding short shots), or with an energy director that has been damaged in handling. In this case, the part is collapsed beyond the energy director, creating an unintended melt, which results in excessive flash around the joint area.
Unlike pneumatic controlled welding systems, a system utilizing a servo controller can be programmed to assure that an initial melt layer thickness exists prior to starting the downward movement of the press. Specifically, it prevents the deformation of the energy director prior to the application of the weld force from counting toward the weld distance.
Additionally, servo systems also allow the user to control the propagation of the melt layer during the weld cycle by precisely varying the velocity of molten material displacement throughout the process. Similar controls used during the hold phase allow for precise control of the material displacement during recrystallization and solidification at the end of the weld.
Evaluating the value of the control features of servo-driven ultrasonic welders and comparing servo-driven welder performance against pneumatic welders was done in many independent studies [2,3,4]. These capabilities also enable the user to build a predictable melt layer, and this study was primarily focused on exploring this phenomenon. Microscopic characterization of the weld cross-section was instrumental in understanding the relationship between the control features of servo-driven welders and melt-layer thickness.
The experimental data that have been assembled to date show an apparent correlation between the sufficient thickness of the melt layer in the weld and increased joint strength and consistency [5,6]. Based on the assertions above, an assumption can be made that it is possible to empirically establish a defined range of melt layer characteristics associated to known weld strength. The purpose of this study was to confirm this correlation. Once the melt-layer-thickness-to-weld-strength relationship for a given part is established, it should be possible to set up online quality control procedures based on monitoring parameters responsible for melt layer formation.
Materials
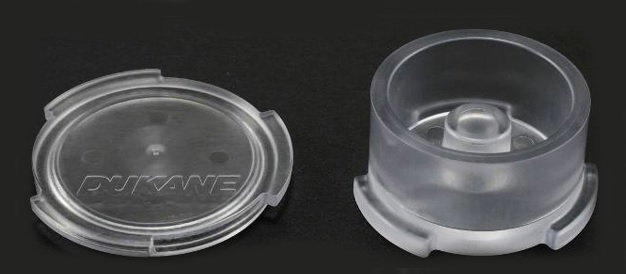
The parts used for this experimentation were ISTeP test parts with a 90˚ (sharp) ED (Figure 1), molded of a common Sabic grade Lexan 121R polycarbonate. This part was developed to provide a test specimen for ultrasonic welding with variable joint designs [7].
Equipment
Experiments were conducted using a 30 kHz 1800 W iQ Servo Ultrasonic Welder, model # 30HS180-2Q-P7, with Melt-Match® technology and an HMI running iQ Explorer II software for data collection and analysis. The tooling was a flat-face, high-gain horn (with a gain factor of two) and a custom-made, drop-in style fixture.
Advanced control features of the servo-driven system were utilized in this experiment including Melt-Detect™, which allows the press to hold its position on the assembly at the initiation of welding until a decrease in force is detected. When the magnitude of the force drop reaches a user-programmable value, expressed as a percentage, the downward movement of the stack continues. This force drop indicates the presence of an initial molten layer [7].
The Melt-Match® feature controls weld velocity and allows for directly controlling the squeeze flow rate of the molten material.
The dynamic hold feature, which allows controlling the squeeze flow rate of the molten material and the collapse distance after ultrasonic vibration is ceased, was used.
These process control features of the servo-driven ultrasonic welders are significantly different from those traditionally utilized in pneumatic welders and, based on previous research, allow precise control of the welding process [5-10].
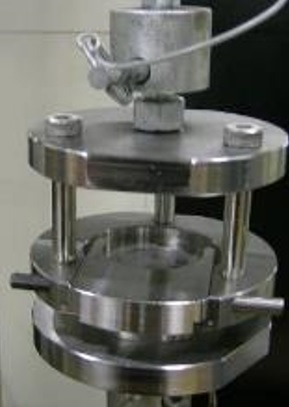
For tensile testing, a Com-Ten Industries test stand used with ANDILOG Variable Speed Controller, and SPIP S9/20 load cell with 22,250 N capacity (accuracy of +/- 0.5%, cross head speed of 4 mm/min) was used with a custom designed fixture, as in Figure 2. Failure load was identified by peak tensile force at break.
An Olympus SZX 10 microscope with polarized light capabilities and SC50 digital camera were utilized for microscopic characterization of the weld area.
Experimentation
Parts were welded using previously optimized weld process settings and tested by varying only three critical process parameters – weld velocity, dynamic hold distance and dynamic hold velocity. In the first part of the experiment, dynamic hold settings were disabled and the following weld velocities were investigated: 0.5 mm/s, 1.0 mm/s, 1.5 mm/s and linearly profiled velocities of 0.4 mm/s to 0.25 mm/s and 0.25 mm/s to 0.4 mm/s. After establishing optimum process settings for weld speed, dynamic hold distance and dynamic hold velocity were varied, holding all other parameters constant. Six dynamic hold distances were evaluated, ranging from 25 microns to 175 microns, at two dynamic hold velocities of 1.0 mm/s and 3.0 mm/s.
Weld strength and consistency were evaluated based on the tensile test results. Along with a tensile test, effect of weld velocity on weld formation also was assessed by microscopic characterization of the weld zone. Representative welds were cross-sectioned, inspected and photographed under the microscope. Their geometric characteristics were analyzed by measuring the melt layer thickness.
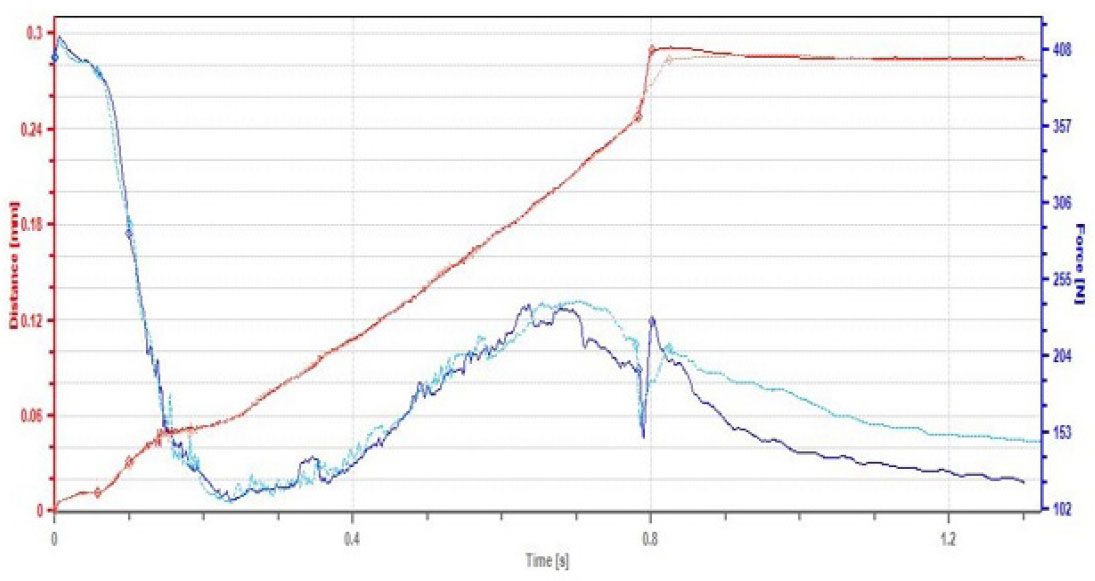
The force and distance diagrams generated by the welder were analyzed for each sample. Representative graphs were correlated to weld strength, melt layer shape and thickness. Analysis of the weld graphs was instrumental in understanding how controlling material melting and displacement during the various stages of the weld formation affects resulting weld morphology.
Results and observations
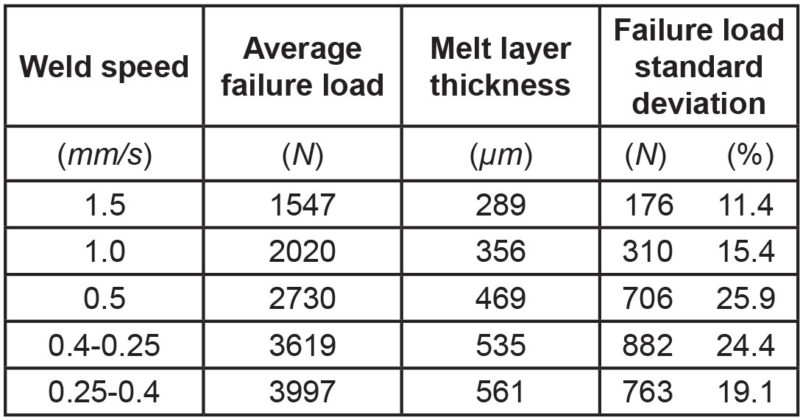
Tensile test results show that a slow, gradual profiled weld velocity (0.25 mm/s to 0.40 mm/s) resulted in the strongest welds (Table 1). Application of low forces to the molten material after the initial melt as detected by the system allows for melt propagation and melt layer buildup in mating parts, which is evident by the melt zone shape observed under the microscope, as shown in Table 1 and Figure 3.
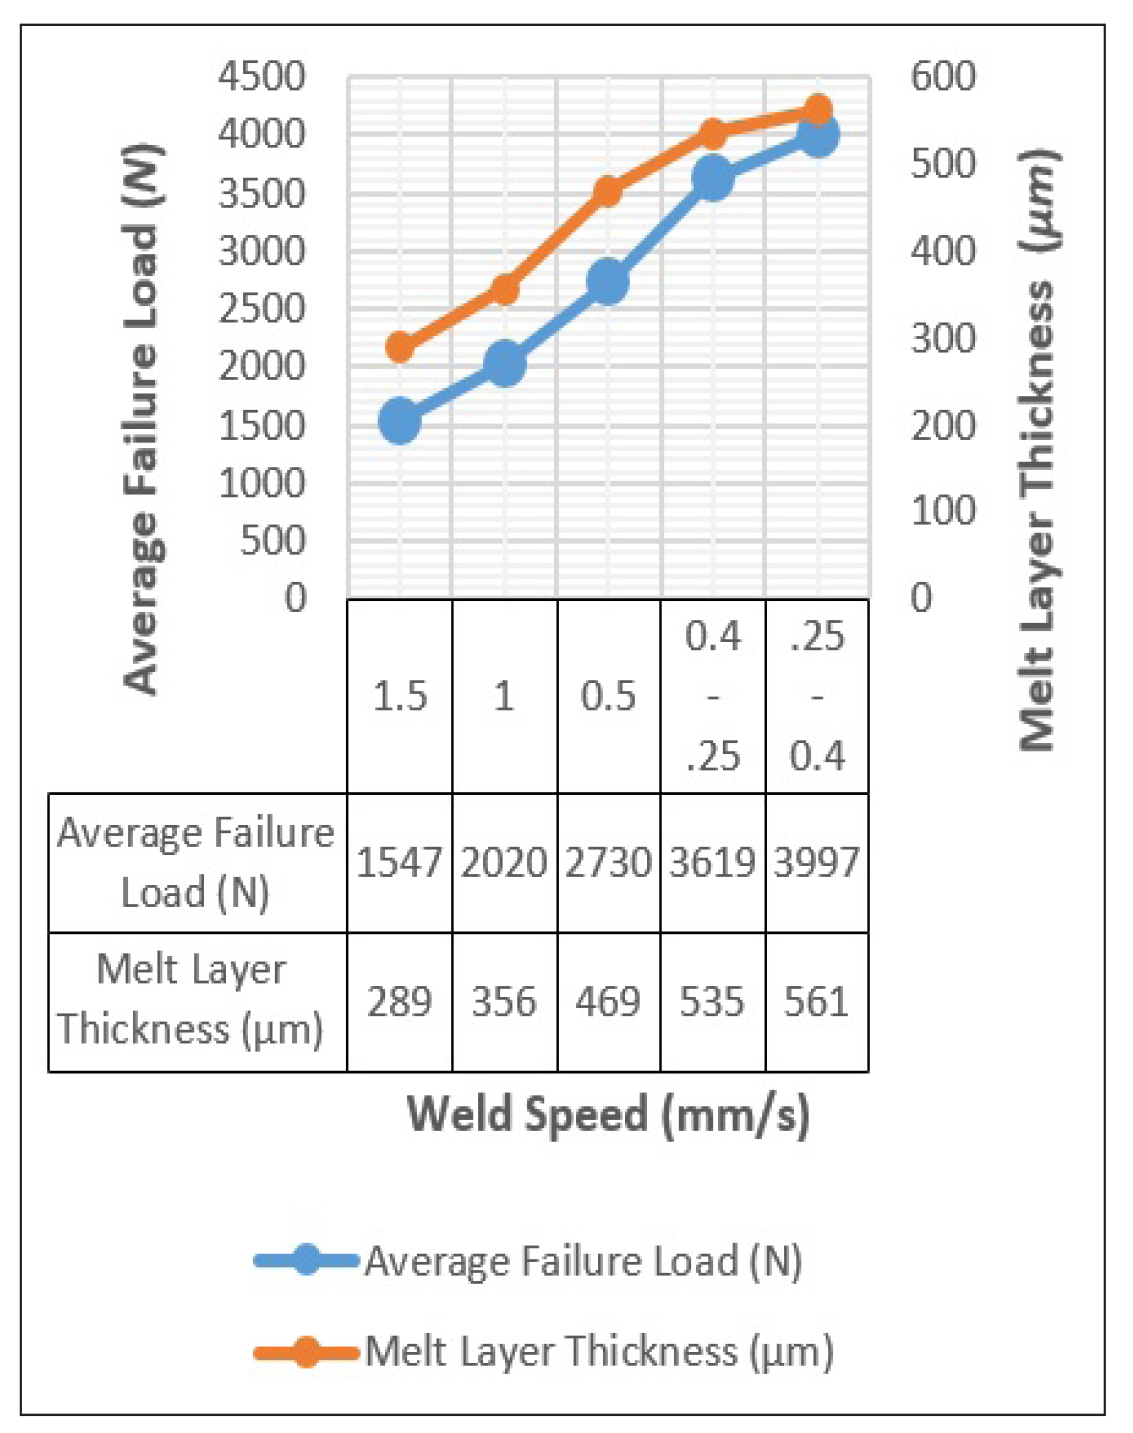
Special attention was given to correlate the weld strength to the melt layer thickness, and such correlation was confirmed by inspecting the weld cross-sections. It was found that thickness of the weld zone correlates closely with the tensile strength of the samples, with stronger welds having more regular melt layer shape and larger, more consistent thickness. The observed correlation was very pronounced and consistent through all the samples cross-sectioned.
The best results were observed using a profiled weld velocity. The application of moderate forces at the later stages of the process generated a steady linear displacement rate. The importance of a steady melt rate, which creates a homogenous molecular structure and a stronger weld, was confirmed by the results of these trials.

Additionally, data generated during this investigation appear to be in agreement with the results of a study conducted at The Ohio State University in 2011. Researchers demonstrated that using a defined velocity profile, with a slower velocity during melt initiation and a faster velocity in the middle and end of the weld, increases weld strength, shortens weld time and reduces surface marking [4]. The reason for these advantages appears to be due to the
generation of a larger, more consistent melt layer. Matching melt propagation with material displacement, i.e. Melt-Match®, is a key to ensuring a strong, consistent bond, but further research is required to verify this assumption.
Previous studies have shown that resulting melt layer thickness also is affected by the dynamic hold distance and velocity [2], which were investigated in this study. As demonstrated by

the extreme cases of dynamic hold distance in this experiment (Figures 4, 5), a weld utilizing 3 mm/s dynamic hold velocity had, in general, a steeper slope of the force/time curve during the dynamic hold cycle than did a weld with 1 mm/s. More specifically, this implies that time is a driving variable, as higher velocity results in shorter hold cycles. Further experimentations are underway to confirm this observation.
However, as was observed, all welded samples using the optimum weld velocity settings, specifically a linear profiled velocity profile of 0.25 mm/s to 0.4 mm/s, failed through the parent material regardless of the dynamic hold velocity and dynamic hold distance, as shown in Table 2.
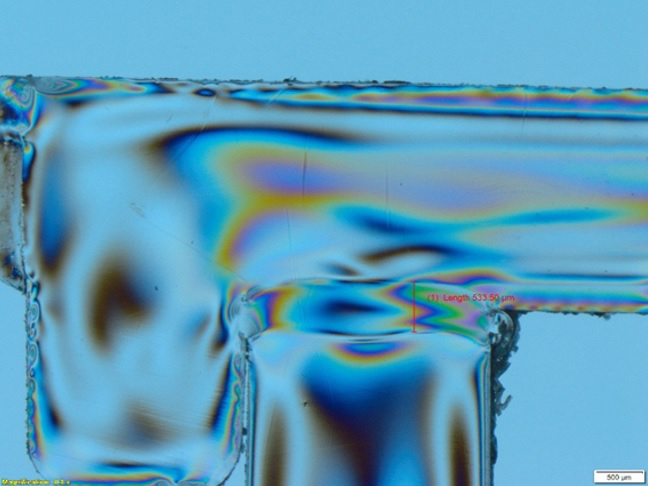
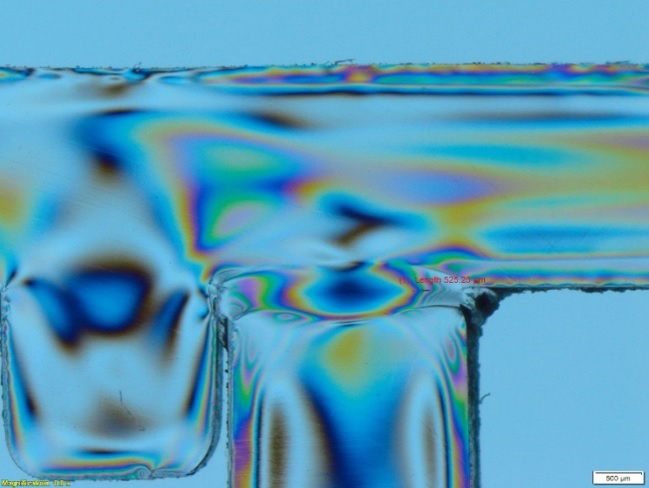
Microscopic inspection of the weld zone illustrates a strong indication of increased level of residual stress for a high dynamic hold distance, shown by a significant increase in the number of fringe lines, as has been previously reported [2]. Figures 6, 7 and 8 further illustrate representative microphotographs of three distinct dynamic hold displacements.
It was also noted that the melt layer thickness remained unchanged after reaching its minimum at 37.5 micron hold distance, regardless of the programmed dynamic hold distance value. As material solidifies, further increase in force required to gain additional weld collapse does not produce any added material displacement, but instead results in increased residual stress in the weld.

Conclusions
This study confirms that a defined velocity profile – with a slower velocity during melt initiation and a faster velocity in the middle and end of the weld – results in stronger, more homogeneous welds which can be correlated to a specific melt layer thickness.
Servo-driven welding equipment also allows the user to actively manipulate the hold phase by programming the amount of material displacement while controlling its squeeze flow rate. These control features made it possible to control the melt layer formation during the hold phase.
It was confirmed that some material displacement during the dynamic hold phase, resulting from moderate force application to the molten material, is beneficial to weld strength and a small pull strength standard deviation. As material solidifies, a further increase in force to gain additional hold collapse does not produce any added material displacement and results in increased residual stress in the weld.
Associating a specific weld velocity profile and dynamic hold settings with formation of a homogeneous melt layer in the interface of the assembly offers a key approach to selecting optimum welding parameters. The results of this study confirm that the thickness of the melt layer closely correlates with the strength of the weld joint. Consequently, this makes the thickness of the melt layer a major predictor of the weld quality.
The capabilities of servo-driven welders in controlling material flow during every stage of the welding cycle enable a user to empirically establish a defined range of melt layer characteristics correlated to known weld strength. This allows the user to reuse the best velocity profile and dynamic hold parameters to generate an optimum melt layer thickness for a given joint geometry. Considering high repeatability and accuracy of servo-driven ultrasonic welders, maintaining these settings in manufacturing processes should result in anticipated melt layer thickness and joint strength. This approach for selecting welding parameters and controlling welding process offers users a significantly more robust way to assure weld quality in manufacturing operations.
Established in 1922, Dukane is a diversified global manufacturer of advanced technology products. The company designs and manufactures plastic welding products for different manufacturing operations around the world. Among the many markets served by Dukane’s products are the automotive, medical, food and packaging industries. A privately held corporation for more than 95 years, Dukane’s principal manufacturing and distribution facility is located in the western Chicago suburb of St. Charles, Illinois.
References
- Handbook of Plastic Joining: a practical guide / M.J. Troughton, 2nd edition, 2008, ISBN 978-0-8155-1581-4 H. Turunen. “Ultrasonic Welding for Plastics” Bachelor’s Thesis, Turku University of Applied Sciences, Finland. 2011.
- A. Benatar. “Servo-Driven Ultrasonic welding of Semi-crystalline Thermoplastics” 39th Annual Symposium of the Ultrasonic Industry Association. Cambridge, MA. 2010.
- A. Mokhtarzadeh and A. Benatar. “Comparison of Servo and Pneumatic Ultrasonic Welding of HDPE Shear Joints” ANTEC 2011.
- A. Savitski, H. Pathak, L. Klinstein, P. Golko, K. Holt, “A Case for Round Energy Director: Utilizing Advanced Control Capabilities of Servo-Driven Ultrasonic Welders in Evaluating Round energy Director Performance”, ANTEC 2014.
- Alex Savitski, Ph.D., Leo Klinstein, Kenneth Holt. “Generating Ultrasonically Welded Parts with Improved Strength and Reliability for Critical Applications in Medical Device Manufacturing by Utilizing Advanced Melt Flow Controls of Servo Driven Ultrasonic Welding Equipment”. ANTEC 2016.
- Miranda Marcus, Bob Aldaz, Loc Nguyen, Ken Holt, “Benefits of Servo-Driven Ultrasonic Welding for Critical Assemblies”, ANTEC 2013.
- M. Marcus, P. Golko, S. Lester, L. Klinstein. “Comparison of Servo-Driven Ultrasonic Welder to Standard Pneumatic Ultrasonic Welder” ANTEC 2009.
- T. Kirkland. “Ultrasonic Welding: The Need for Speed Control” Plastics Decorating. July/August, 2012
- US Patent 7,819,158. Oct. 26, 2010. Klinstein et al. Ultrasonic Press Using Servo Motor with Integrated Linear Actuator
- Alex Savitski, Ph.D., Leo Klinstein, Kenneth Holt ” Utilizing Dynamic Hold Capability of Servo-Driven Ultrasonic Welders in Studying Cooling Phase of the Ultrasonic Welding Process” ANTEC 2017.
- J. Feingold, “Stress: Diagnose It Before It Ruins Your Parts”, Plastics Technology, Dec. 2005
- US Patent 8,720,516. May 13, 2014. Klinstein et al. Ultrasonic Press Using Servo Motor with Delayed Motion