


Evaluation of the quality of polymer welds is essential to the development and production maintenance of a welding process. However, it can be challenging to select an evaluation method due to the wide variety of options.
A comparison of some popular weld quality evaluation methods is discussed in this article, as well as the preparation procedures for each and what can be learned from each method. There are many methods available to evaluate quality of polymer welds. Traditionally, these methods are categorized as destructive or nondestructive.
Additionally, the types of information provided by a testing method can be important selection criteria for process development and maintenance. Quantitative tests that provide numerical quality attributes for weld evaluation include:
- Pressure decay leak testing
- Tensile testing
- Shear testing
- Peel testing
- Push-out testing
- Bend testing
- Torsional testing
- Creep testing
- Fatigue testing
- Dimensional analysis
Additionally, a variety of imaging methods can be applied, which can provide a great deal of additional information about the weld characteristics, although usually not quantifiable information. Some of these methods include:
- Cross-sectional analysis
- Computerized tomography (CT) scanning
- Microtome slicing
- Visual inspection
- X-ray
- Ultrasonic testing
- Fractography
This work examines a select few of these evaluation methods, the preparation and equipment required for each, as well as what can be learned from each method. Pressure decay leak testing, tensile testing, cross-sectional analysis, microtome slicing and CT scanning were the selected methods for comparison.
Literature review
Several standards exist to guide the analysis of polymers and plastic welds. The American Welding Society Specification for Standardized Ultrasonic Welding Test Specimen for Thermoplastics describes both the design of standard I-beam samples and the method by which they should be tensile tested [1].
However, in previous research, these I-beam specimens have proven inconsistent in molding, fixturing and testing. Challenges included achieving proper leveling and alignment with no alignment features included in the design, sink marks and warp leading to a non-flat joint, and the tendency for one end of the part to break first during tensile testing, leading to a zipper effect. These observations led to the development of a new standard test part that has been used for this work [2].
American Society for Testing and Materials standards detail methods for pressure decay leak testing and sectional analysis of polymers that can be applied to welded joints [3, 4]. Guidelines for cryotome preparation of polymer slices can be found in the book, Compositional and Failure Analysis of Polymers: A Practical Approach, by John Scheirs [5].
Materials

Dukane ISTeP™-style standard test parts were used, which can be evaluated via several methods including pressure, tensile and torsional testing. These parts are available with a variety of joint designs.
For ultrasonic welding, polycarbonate (PC) and polybutylene terephthalate (PBT) materials were used. The PC parts had a 90-degree energy director and the PBT parts had a 60-degree energy director. For laser welding, 15% glass-filled polyamide (PA) was used, with a flat joint.
Equipment
Assemblies were welded via two joining processes: ultrasonic and laser. The ultrasonic welds were made using a 20-kHz, pneumatic ultrasonic welder with weld-by-distance capability. The amplitude of the transducer-booster-sonotrode stack was measured using a displacement gauge.
The laser welds were made using a 980-nm ND:Yag laser mounted to an XY table for motion control and a small pneumatic press to apply pressure.
The laser output was controlled via voltage, and the power output in Watts was measured using an Ophir energy monitor.
Pressure decay leak testing was performed using a Cincinnati Test Systems Sentinel C28 air decay leak tester. CT scans were made using a Nikon XTH 225 CT System with 130 kV and 30 W of power, and a rotating target. Cryomicrotomes were made using a Leitz Kryostat 1720 cryomicrotome. All images were taken using an Olympus BX51 microscope with reflective lighting for the sections and transmissive lighting for the cryomicrotome slices.
Tensile testing was performed on an Instron machine using tensile test tooling designed specifically for use with Dukane ISTeP™ parts, as shown in Figure 2. The welded assemblies were pulled at a speed of 2.5 mm/minute.
Experimental procedure
A total of 32 assemblies were welded. Twelve PBT assemblies, 10 PC assemblies and two assemblies with a PC cap and PBT body were welded via ultrasonics. Eight PA assemblies were welded via contour laser welding. Several intentional defects were created, such as over welding, under welding, insufficient amplitude, insufficient power, insufficient pressure and insufficient collapse. Notches were cut into the bottom halves of two assemblies – those to be CT scanned from Sets B and D.
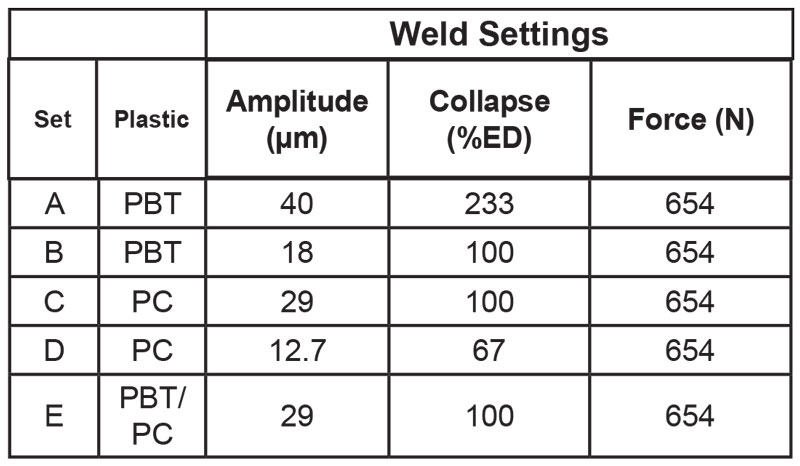
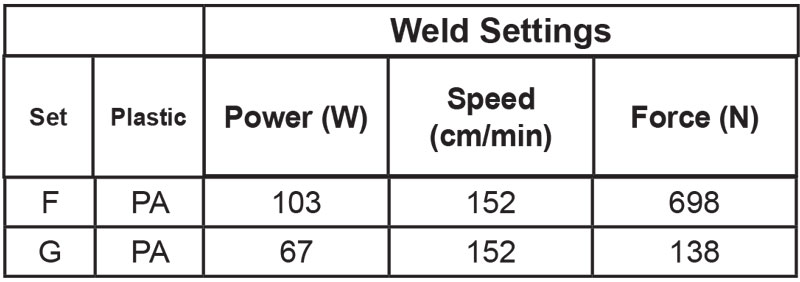
Of the 32 welded assemblies, 14 were analyzed. These assemblies were made in pairs so that two assemblies each were made with seven material, process and parameter combinations, as described in Tables 1 and 2. All 14 were pressure decay leak tested. One of each pair, a total of seven, then were CT scanned and tensile tested. The remaining seven were cross-sectioned and cryomicrotome sliced.
Where %ED refers to the percent of the designed energy director height. Therefore, the Set A assemblies were over-collapsed to over twice the designed height of the energy director, while the Set D assemblies were under collapsed.
The cross sections were prepared using the following process. First, the assemblies were cut in half on a band saw, then cut again on a diamond blade saw for a smoother cut. The sectioned assemblies then were placed cut side down in a mold and cold mounted in epoxy.
The sectioned assemblies were progressively polished per ASTM guidelines [3] starting with 320-grit sandpaper using water to remove debris and particulate. At this grit, the sections were polished in 30- to 45-second increments until planar. This step was followed by polishing with 400-grit, 600-grit and 800-grit sandpaper, each in 30-second increments with water flowing.
Next, low-napped, synthetic rayon cloth using diamond and colloidal silica polishing compounds were used to polish to the desired finish. The sections were polished in this way in one-to-two-minute increments, progressing from 9-μm diamond to 3-μm diamond to 1-μm diamond suspensions.
Finally, the sections were finished using a colloidal silica polish for three to four minutes. The timing and repetition of each of these steps requires analysis of the progress and determination whether to move on or repeat at the same polishing intensity.
The sections were photographed using an optical microscope. After taking an image of the sections in the as-polished condition, the sections were then heat treated by passing a hot air gun at a height of about 10 mm over the surface of the sections for five to 10 seconds incrementally, viewing the section after each treatment to determine if more heat needed to be applied.
A Model HG-301A, 120 VAC, 60-Hz, 12-Amp hot air gun, with a temperature range of 149°C to 260°C was used.
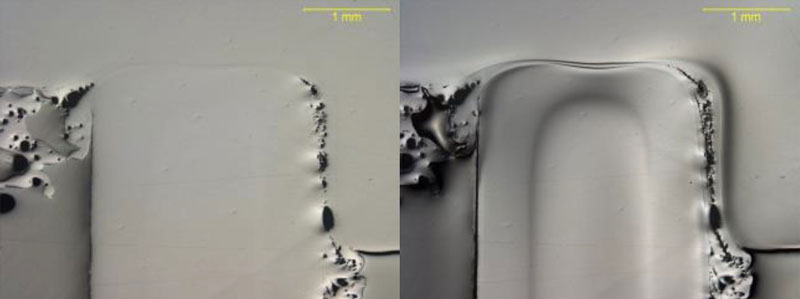
This process allows the polymer chains on the surface of the section that have been smeared during cutting and polishing to relax, revealing additional information about the weld quality. Figure 3 shows an example of the change in the appearance of the cross section from the as-polished condition to the heat-treated condition.
Heat treating can be a powerful tool to reveal details of not only the flow and bonding area in the weld, but also details of the molding process. As can be seen in the heat-treated section in Figure 3, there is a variation in the polymer between the outer edge of the molded component and the interior, which indicates a different temperature history between the outer and inner areas. However, if not done carefully and incrementally, heat treating can distort the plastic and cause a loss of detail. Very little variation in heating time and distance from the hot air source can account for significant differences in appearance.
The cryomicrotome samples were prepared by first cutting a small piece out of the weld, approximately 2 mm cubed. Care was taken to ensure that the top and bottom surfaces were perpendicular to the weld and parallel to each other. The piece was then placed on a mount in a small dab of Tissue-Tek optimum cutting temperature compound that hardens when cooled to -10°C and below. The sample was placed so that the weld line was perpendicular to the slicing direction. If the weld is parallel, additional stress can be induced during slicing that may weaken or fracture a weld.
The cryomicrotome was set to -40°C, and the mounts were left to harden for several hours before slicing. The thickness was set to 10 μm. Once sliced, the thin sections would curl up. Tweezers were carefully used to unfurl the rolls so they could be sandwiched between two slides for inspection. If not careful, the tweezer can mark the cryomicrotome slices in the area of interest, ruining the sample. Care was taken to clean the slides and slices of dust and debris.
For CT scanning, the assemblies were scanned as a whole. Because no sectioning was required, these assemblies could be tensile tested after imaging. A 180 kV transmission x-ray source was used with an applied voltage of 120 kV and a current of 30 W. The sample was positioned as close to the source as possible to optimize voxel resolution, while ensuring complete stability to prevent any part movement during scanning. Additionally, the assembly was tilted to mitigate artifacts that can be associated with CT scanning procedures.
Results and discussion

Table 3 summarizes the results of the pressure decay leak and tensile testing. Note that the CT-scanned assemblies from sets B and D had been intentionally notched in the joint area, which resulted in a major leak during pressure decay leak testing. The assemblies from sets A and C both leaked profusely. However, this was due to damage in the center of the top part, not due to a weak weld.
During tensile testing, both the Set A and Set C assemblies failed in the base material, indicating a much stronger, more cohesive weld than some of the more leak-tight assemblies (i.e., Set B and Set D) . Failure in the base material is a limiting factor of mechanical testing methods like tensile testing creating an artificial maximum above which the weld strength cannot be quantified.
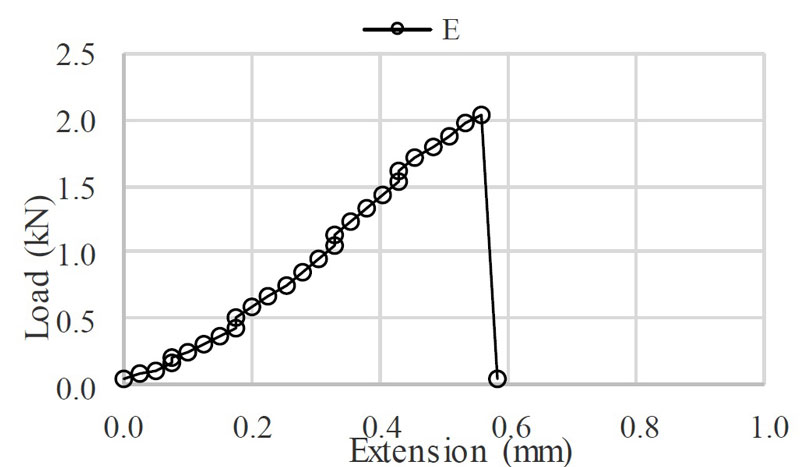
While the same settings were used for the PC cap to PBT base as were used for Set C, the strongest of the sets tested, the tensile strength was greatly reduced, as shown in Figure 4. This result is to be expected when dissimilar materials are welded, as the mismatch in melt viscosity and melting temperatures can make it difficult for intermolecular diffusion to occur.
Neither of the laser-welded sets resulted in ductile fracture. However, Set F, which was welded with greater pressure and power than Set G, provided a leak-tight seal, per Table 3.
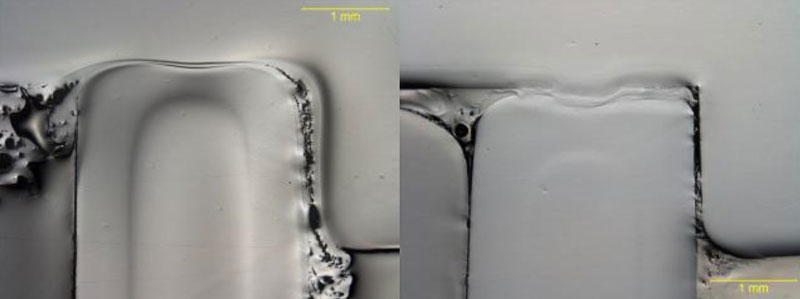
The cross sections of the Set A and Set B assemblies show more compression in the Set A welds and more pushed out flash, Figure 5. This result correlates with the fact that the Set A assemblies were collapsed to over twice the depth than the Set B assemblies were during welding.
Both the Set A and Set B welds are free of voids, unbonded sections, and have an even, consistent appearance across the width of the joint. This correlates well with the leak-tight joint provided by Set B, although the pressure decay leak rate of Set A could not be measured due to damage in the middle of the top of the cap. While the same type of damage occurred on Set B, it did not create a hole, Figure 6. This damage is most likely due to diaphragming of the cap, leading to strong amplitudes of vibration in the center and melting.
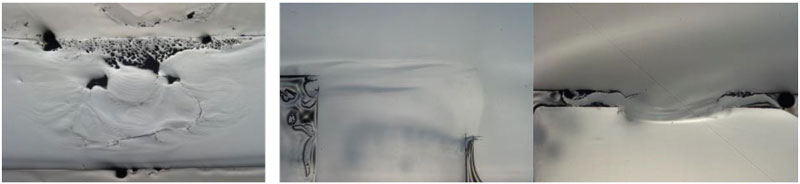
It can clearly be seen from the cross sections that the Set D assemblies were under welded, Figure 7. Additionally, the section shows a distinct lack of adhesion between the melt that was pushed out of the weld and the surface of the cap where it makes contact. The Set C weld, however, shows a complete and even weld across the entire joint surface. This correlates well with the greater tensile strength demonstrated by the Set C assemblies.
The cross section of the Set E assemblies, the PC cap to the PBT body dissimilar material weld, shows poor adhesion between the two parts. While both materials melted and flowed, there is still a distinct line of separation through the weld where the polymer chains from each original bulk material pulled away from each other, indicating little intermolecular diffusion occurred.
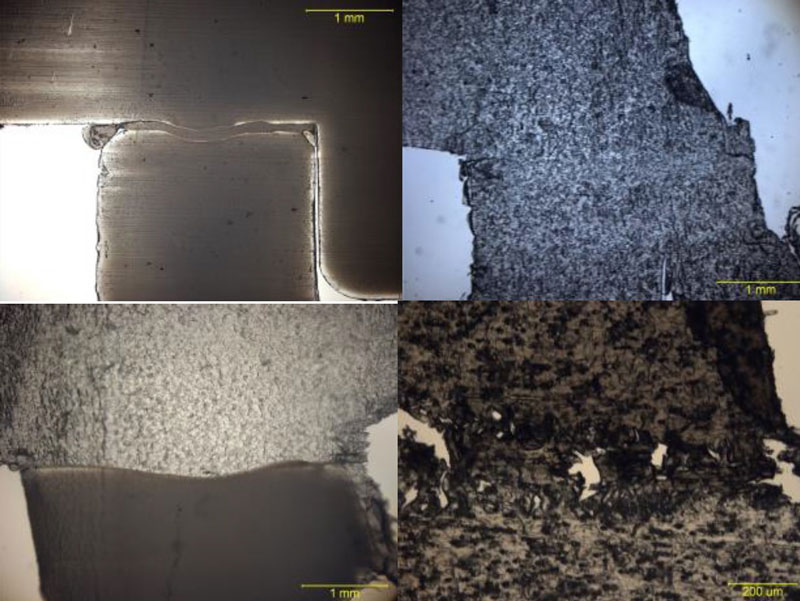
The cross sections of the laser welded assemblies, sets F and G, show very poor welding, Figure 8. Heat treating of these parts did not reveal any additional detail, as the voids and flaws in the weld can be clearly seen in the as-polished condition. Considering the uneven appearance of the Set F weld and the visible porosity, it is surprising that this weld was leak tight, per Table 3.
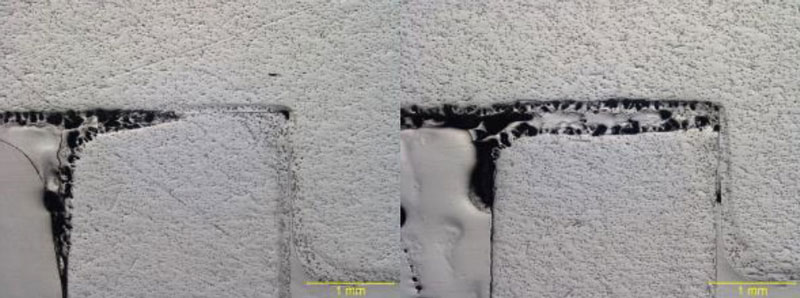
The cryomicrotome slices provide a slightly different view of the cross sections of the assemblies, Figure 9. The slice of the Set B assembly shows the same amount of collapse and uniform flash as the cross section, but also shows that there is a very thin region between the weldment and the base material that is more optically transparent than either. This result is likely a remnant of a quenched skin layer, as this more transparent line can be seen on the edges of both molded parts.
The cryomicrotome slice of the Set C assembly indicates a complete weld, correlating with the cross section and tensile test for this same set. On the Set C slice and on the Set F slice, a slightly darker area can be seen on the right side of the cap, just above the weld. These areas are where the slice was not completely unfurled after cutting and has left a small fold.
The cryomicrotome slice of the Set E assembly shows the difference between the two dissimilar materials more clearly than the cross section did. The slice of the Set F assembly shows porosity in even the welded right side of the joint (as shown in Figure 8), which is enlarged in the image in Figure 9. Creating a cryomicrotome of an assembly with a poor weld like this can be quite challenging due to the tendency for the thin slices to break at the joint.
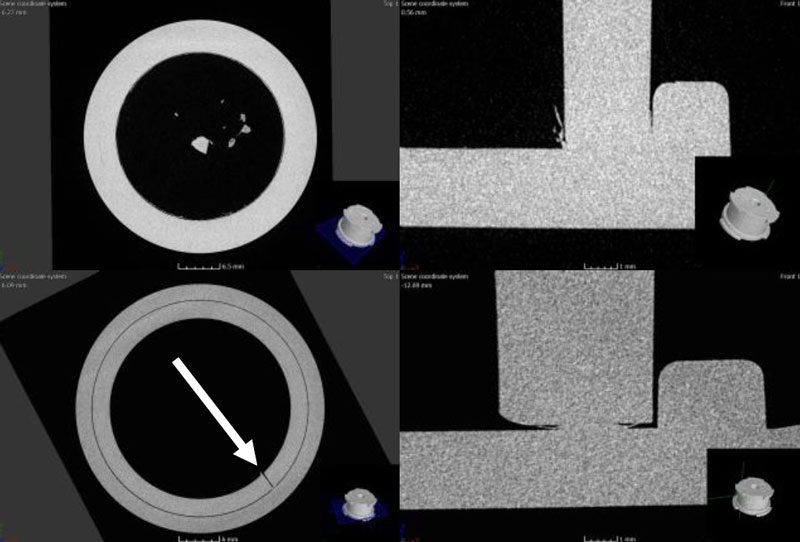
The CT scans of the Set A and Set B assemblies show very similar structure to the cross sections and cryomicrotome slice, Figure 10, including the excessive flash present due to the significant meltdown of the joint used for that parameter set. An additional feature that is revealed, however, is the notch that was cut into the Set B assembly, which can be seen when taking a top-
down view of the joint.
The CT scans of the Set C and Set D assemblies are equally informative, Figure 11. The notch is again very clear in the top-down view (identified by an arrow). The scan is accurate enough to see the curve of the pushed-out melt in the Set D weld on the side view.
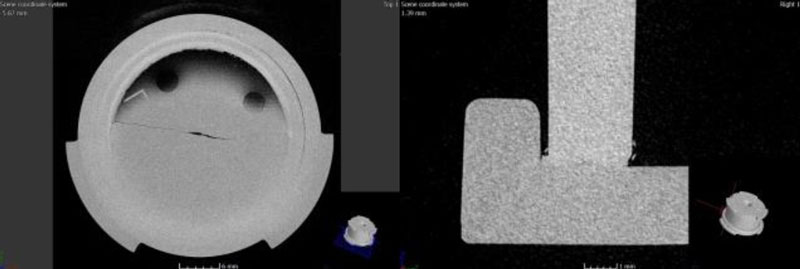
The CT scan of the Set E assembly shows where the cap cracked during welding, as well as the melt formation during welding, Figure 12.

The CT scans of the Set F and Set G assemblies both show the excessive porosity in these welds and in the flash generated during these welds. This result correlates very well with the cross sections of these assemblies.
Conclusions
The testing illustrates the advantages and disadvantages of each evaluation method and what can be learned or missed from any one testing method. Tensile testing correlates quite
well with overall weld quality but cannot account for discrete gaps or inclusions in the weld that might affect only a small area. Pressure decay leak testing is very good for detecting minute and inconsistent weld flaws, but does not correlate well to overall weld quality, as even very weak welds that have good wetting in the melt flow can be leak tight.
Cross-sectional analysis gives a very good indication of the overall weld quality but will almost never reveal a discrete flaw due to the
ability to see only one small section of the weld at a time. CT scanning is not adept at checking for quality of fusion but can be used to identify and locate discrete flaws very well.
Cryomicrotome slicing gives less information on whether intermolecular diffusion has occurred than a cross section but does allow the opportunity to evaluate relative crystallinity. Depending on the material, spherulite formation in the crystalline region can even be observed using polarized lighting.
Acknowledgements
EWI would like to thank Branson for providing the welding press and Dukane for the donation of the ISTeP™ parts, without which this work would not have been possible.
Additionally, a great deal of appreciation goes to EWI technicians Wayne Papageorge for expertise in polymer crosssection preparation, Daniel Kmiotek for CT scanning and Steve O’Mara for tensile testing of the samples.
References
- Specification for Standardize Ultrasonic Welding Test Specimen for Thermoplastics, American Welding Society G1.2M/G1.2:1999.
- G. Marcus, K. Lester, Comparison of Servo-Driven Ultrasonic Welder to Standard Pneumatic Ultrasonic Welder, ANTEC (2009).
- Standard Guide for Preparation of Plastics and Polymeric Specimens for Microstructural Examination, ASTM E2015-04 (Reapproved 2014).
- Standard Practice for Pressure Decay Leak Test Method, ASTME2930-13 (2013).
- J. Scheirs, Compositional and Failure Analysis of Polymers: A Practical Approach, John Wiley & Sons, Ltd, (2000).
Miranda Marcus is responsible for leading EWI’s technical expertise for all plastic and composite welding technologies. She has extensive knowledge of plastic welding technologies, their advantages and limitations, including ultrasonic, laser, spin, hot plate, vibration, thermal staking, radio frequency and infrared.
EWI empowers industry leaders to overcome complex manufacturing challenges and integrate new processes to bring products to market more quickly and efficiently. For more information, visit ewi.org or call 614.688.5000.
 Miranda Marcus
applications engineer
EWI